Market Outlook
March 13, 2018
Market Cues
Domestic Indices
Chg (%)
(Pts)
(Close)
Indian markets are likely to open flat tracking global indices and SGX Nifty.
BSE Sensex
1.8
611
33,918
U.S. stocks turned mixed over the course of the trading session. The mixed
Nifty
1.9
195
10,421
performance on the day came on the heels of the strong upward seen in the
Mid Cap
0.8
121
16,108
previous session. The Dow fell down by 0.6% to close at 25,179. The NASDAQ
Small Cap
0.6
97
17,403
gained 0.4% to close at 7,588.
Bankex
1.6
438
27,785
U.K. stocks were little changed after opening on a positive note earlier in the day on
the back of better-than-expected U.S. jobs report. The FTSE 100 was down by 0.1%
Global Indices
Chg (%)
(Pts)
(Close)
to end at 7,215.
Dow Jones
(0.6)
(157)
25,179
On domestic front, Indian shares rallied during the last trading session, tracking firm
Nasdaq
0.4
28
7,588
global markets as geopolitical tensions eased somewhat, trade-war worries subsided
FTSE
(0.1)
(10)
7,215
and a robust U.S. jobs report stoked optimism about global growth. The BSE Sensex
closed higher by 1.8% at 33,917
Nikkei
(0.2)
(33)
21,791
Hang Seng
(0.1)
(22)
31,572
News Analysis
Shanghai Com
(0.1)
(2)
3,324
Feb retail inflation eases to 4-month low of 4.44%, IIP grows 7.5% in Jan
Detailed analysis on Pg2
Advances / Declines
BSE
NSE
Advances
1,364
984
Investor’s Ready Reckoner
Declines
1,399
832
Key Domestic & Global Indicators
Unchanged
159
57
Stock Watch: Latest investment recommendations on 150+ stocks
Refer Pg5 onwards
Volumes (` Cr)
Top Picks
BSE
4,121
CMP
Target
Upside
Company
Sector
Rating
(`)
(`)
(%)
NSE
27,048
Blue Star
Capital Goods Accumulate
791
867
9.7
Dewan Housing Finance
Financials
Buy
514
720
40.1
Net Inflows (` Cr)
Net
Mtd
Ytd
Century Plyboards
Forest Products
Buy
323
400
24.0
FII
608
1,992
2,485
Navkar Corporation
Other
Buy
159
265
66.9
*MFs
94
(690)
24,514
KEI Industries
Capital Goods
Buy
365
436
19.6
More Top Picks on Pg4
Top Gainers
Price (`)
Chg (%)
Key Upcoming Events
NETWORK18
54
8.2
Previous
Consensus
Date
Region
Event Description
Reading
Expectations
JPASSOCIAT
15
5.4
Mar13
US
Consumer price index (mom)
0.50
0.20
RELCAPITAL
432
5.1
Mar14
US
Producer Price Index (mom)
0.70
SREINFRA
82
5.1
Mar14
India
Monthly Wholesale Prices YoY%
2.84
2.50
MMTC
48
5.0
Mar15
US
Initial Jobless claims
231.00
225.00
Mar15
Euro Zone
Euro-Zone CPI (YoY)
1.20
1.20
More Events on Pg7
Top Losers
Price (`)
Chg (%)
IDBI
65
(8.5)
ANDHRABANK
36
(6.9)
BAJAJHIND
10
(6.1)
PFC
88
(5.2)
WELCORP
159
(4.5)
As on March 12, 2018
Market Outlook
March 13, 2018
News Analysis
Feb retail inflation eases to 4-month low of 4.44%, IIP grows 7.5% in
Jan
Industrial production grow at a high rate of 7.5% in January 2018 against 3.5%
in the year-ago month on the back of good show by manufacturing coupled with
higher off take of consumer and capital goods. The Index of Industrial Production
(IIP) had grown at 7.1% in December 2017, according to the data released by the
Central Statistics Office (CSO).
The IIP growth in January this year was mainly on account of uptick in
manufacturing sector which constitutes 77.63% of the index. It grew by 8.7%
during the month as compared to 2.5% in January 2017, showing signs of
recovery in the economy. Retail inflation fell to a 4-month low of 4.44% in
February on cheaper food articles and lower cost for fuel.
Economic and Political News
India attracts $209bn FDI during Apr 2014 to Dec 2017
Government tables bill to streamline chit fund sector, hike foremen's
commission
Tea exports to Pakistan increased by 32% in 2017-18 during Apr to Jan
Corporate News
ACC and Ambuja Cements plan to enter into master supply agreement
L&T JV bags Rs 4.42-bn order for supply of forgings for steam generators
RCom to appeal NCLT stay order against Reliance Infratel asset sale
Tata Sons to sell $1.2-bn worth TCS shares in Rs 2,872-Rs 2,925 price
range
Market Outlook
March 13, 2018
Top Picks
Market Cap
CMP
Target
Upside
Company
Rationale
(` Cr)
(`)
(`)
(%)
Strong growth in domestic business due to its
leade`hip in acute therapeutic segment. Alkem expects
Alkem Laboratories
26,355
2,204
2,441
10.7
to launch more products in USA, which bodes for its
international business.
Favorable outlook for the AC industry to augur well for
Cooling products business which is out pacing the
Blue Star
7,586
791
867
9.7
market growth. EMPPAC division's profitability to
improve once operating environment turns around.
With a focus on the low and medium income (LMI)
consumer segment, the company has increased its
Dewan Housing Finance
16,119
514
720
40.1
presence in tier-II & III cities where the growth
opportunity is immense.
Well capitalized with CAR of
18.1% which gives
sufficient room to grow asset base. Faster resolution of
ICICI Bank
1,93,218
300
416
38.6
NPA would reduce provision cost, which would help to
report better ROE.
High order book execution in EPC segment, rising B2C
KEI Industries
2,857
365
436
19.6
sales and higher exports to boost the revenues and
profitability
Expected to benefit from the lower capex requirement
Music Broadcast
2,146
376
475
26.3
and 15 year long radio broadcast licensing.
Massive capacity expansion along with rail advantage
Navkar Corporation
2,389
159
265
66.9
at ICD as well CFS augur well for the company
Strong brands and distribution network would boost
Siyaram Silk Mills
2,933
626
851
36.0
growth going ahead. Stock currently trades at an
inexpensive valuation.
Market leadership in Hindi news genre and no. 2
viewership ranking in English news genre, exit from the
TV Today Network
2,695
452
508
12.4
radio business, and anticipated growth in ad spends
by corporate to benefit the stock.
After GST, the company is expected to see higher
volumes along with improving product mix. The
Maruti Suzuki
2,66,170
8,811
10,619
20.5
Gujarat plant will also enable higher operating
leverage which will be margin accretive.
We expect loan book to grow at 24.3% over next two
GIC Housing
2,043
379
655
72.7
year; change in borrowing mix will help in NIM
improvement
We expect CPIL to report net Revenue/PAT CAGR of
~17%/16% over FY2017-20E mainly due to healthy
7,170
323
400
24.0
growth in plywood & lamination business, forayed into
Century Plyboards India
MDF & Particle boards on back of strong brand &
distribution network.
We expect sales/PAT to grow at 13.5%/20% over next
LT Foods
2,802
88
128
46.1
two years on the back of strong distribution network &
addition of new products in portfolio.
Third largest brand play in luggage segment Increased
product offerings and improving distribution network is
Safari Industries
1,193
536
650
21.2
leading to strong growth in business. Likely to post
robust growth for next 3-4 years
We expect HSIL to report PAT CAGR of ~15% over
FY2017-20E owing to better improvement in operating
HSIL
2,933
406
510
25.7
margin due price hike in container glass segment,
turnaround in consumer business.
We expect financialisation of savings and increasing
Aditya Birla Capital
33728
154
218
41.5
penetration in Insurance & Mutual fund would ensure
steady growth.
Source: Company, Angel Research
Market Outlook
March 13, 2018
Fundamental Call
Market Cap
CMP
Target
Upside
Company
Rationale
(` Cr)
(`)
(`)
(%)
CCL is likely to maintain the strong growth trajectory
CCL Products
3,837
288
360
24.8
over FY18-20 backed by capacity expansion and new
geographical foray
We forecast Nilkamal to report top-line CAGR of ~9%
to `2,635cr over FY17-20E on the back of healthy
Nilkamal
2,471
1,656
2,178
31.5
demand growth in plastic division. On the bottom-line
front, we estimate ~10% CAGR to `162cr owing to
improvement in volumes.
We expect sales/PAT to grow at 9%/14% over next two
years on the back of healthy demand growth in
Shreyans Industries
185
134
247
84.4
printing. Further, China had banned making paper
from waste pulp which would benefit Indian paper
companies.
The prism has diversified exposure in the different
segment such as Cement, Tile & ready mix concrete.
Prism Cement
5,864
117
160
37.3
Thus we believe, PCL is in the right place to capture
ongoing government spending on affordable housing
and infrastructure projects.
Elantas Beck India is the Indian market leader in liquid
insulation segment used in electrical equipments like
Elantas Beck India Ltd
1,607
2,027
2,500
23.3
motors, transformers etc. It derives demand from
several industries which are expected to register 10%+
CAGR in demand in the coming years.
RPL to report healthy top-line CAGR of ~13% over
FY17-20E on the back of healthy demand in printing &
Ruchira Papers Ltd.
367
164
244
49.1
writing paper segments. On the bottom-line front, we
estimate ~16% CAGR over FY17-20E owing to strong
improvement in operating performance.
Greenply Industries Ltd (GIL) manufactures plywood &
allied products and medium density fibreboards
(MDF). GIL to report net revenue CAGR of ~14% to
Greenply Industries
3,968
324
395
22.1
~`2,478cr over FY2017-20E mainly due to healthy
growth in plywood & lamination business on the back
of strong brand and distribution network
Source: Company, Angel Research
Market Outlook
March 13, 2018
Key Upcoming Events
Global economic events release calendar
Bloomberg Data
Date
Time Country
Event Description
Unit
Period
Last Reported
Estimated
Mar 13, 2018
6:00 PMUS
Consumer price index (mom)
% Change
Feb
0.50
0.20
Mar 14, 2018
US
Producer Price Index (mom)
% Change
Feb
0.70
12:00 PMIndia
Monthly Wholesale Prices YoY%
% Change
Feb
2.84
2.50
Mar 15, 2018
6:00 PMUS
Initial Jobless claims
Thousands
Mar 10
231.00
225.00
3:30 PMEuro Zone
Euro-Zone CPI (YoY)
%
Feb F
1.20
1.20
India
Imports YoY%
% Change
Feb
26.10
Mar 16, 2018
India
Exports YoY%
% Change
Feb
9.10
6:45 PMUS
Industrial Production
%
Feb
(0.05)
0.30
6:00 PMUS
Housing Starts
Thousands
Feb
1,326.00
1,288.00
6:00 PMUS
Building permits
Thousands
Feb
1,377.00
1,320.00
Mar 20, 2018
8:30 PMEuro Zone
Euro-Zone Consumer Confidence
Value
Mar A
0.10
3:00 PMUK
CPI (YoY)
% Change
Feb
3.00
Mar 21, 2018
7:30 PMUS
Existing home sales
Million
Feb
5.38
5.42
3:00 PMUK
Jobless claims change
% Change
Feb
(7.20)
11:30 PMUS
FOMC rate decision
%
Mar 21
1.50
1.75
Mar 22, 2018
2:00 PMGermany
PMI Services
Value
Mar P
55.30
5:30 PMUK
BOE Announces rates
% Ratio
Mar 22
0.50
2:00 PMGermany
PMI Manufacturing
Value
Mar P
60.60
Mar 23, 2018
7:30 PMUS
New home sales
Thousands
Feb
593.00
615.00
Mar 27, 2018
7:30 PMUS
Consumer Confidence
S.A./ 1985=100
Mar
130.80
Mar 28, 2018
6:00 PMUS
GDP Qoq (Annualised)
% Change
4Q T
2.50
Mar 29, 2018
1:25 PMGermany
Unemployment change (000's)
Thousands
Mar
(22.00)
2:00 PMUK
GDP (YoY)
% Change
4Q F
1.40
Mar 31, 2018
6:30 AMChina
PMI Manufacturing
Value
Mar
50.30
Source: Bloomberg, Angel Research
Market Outlook
March 13, 2018
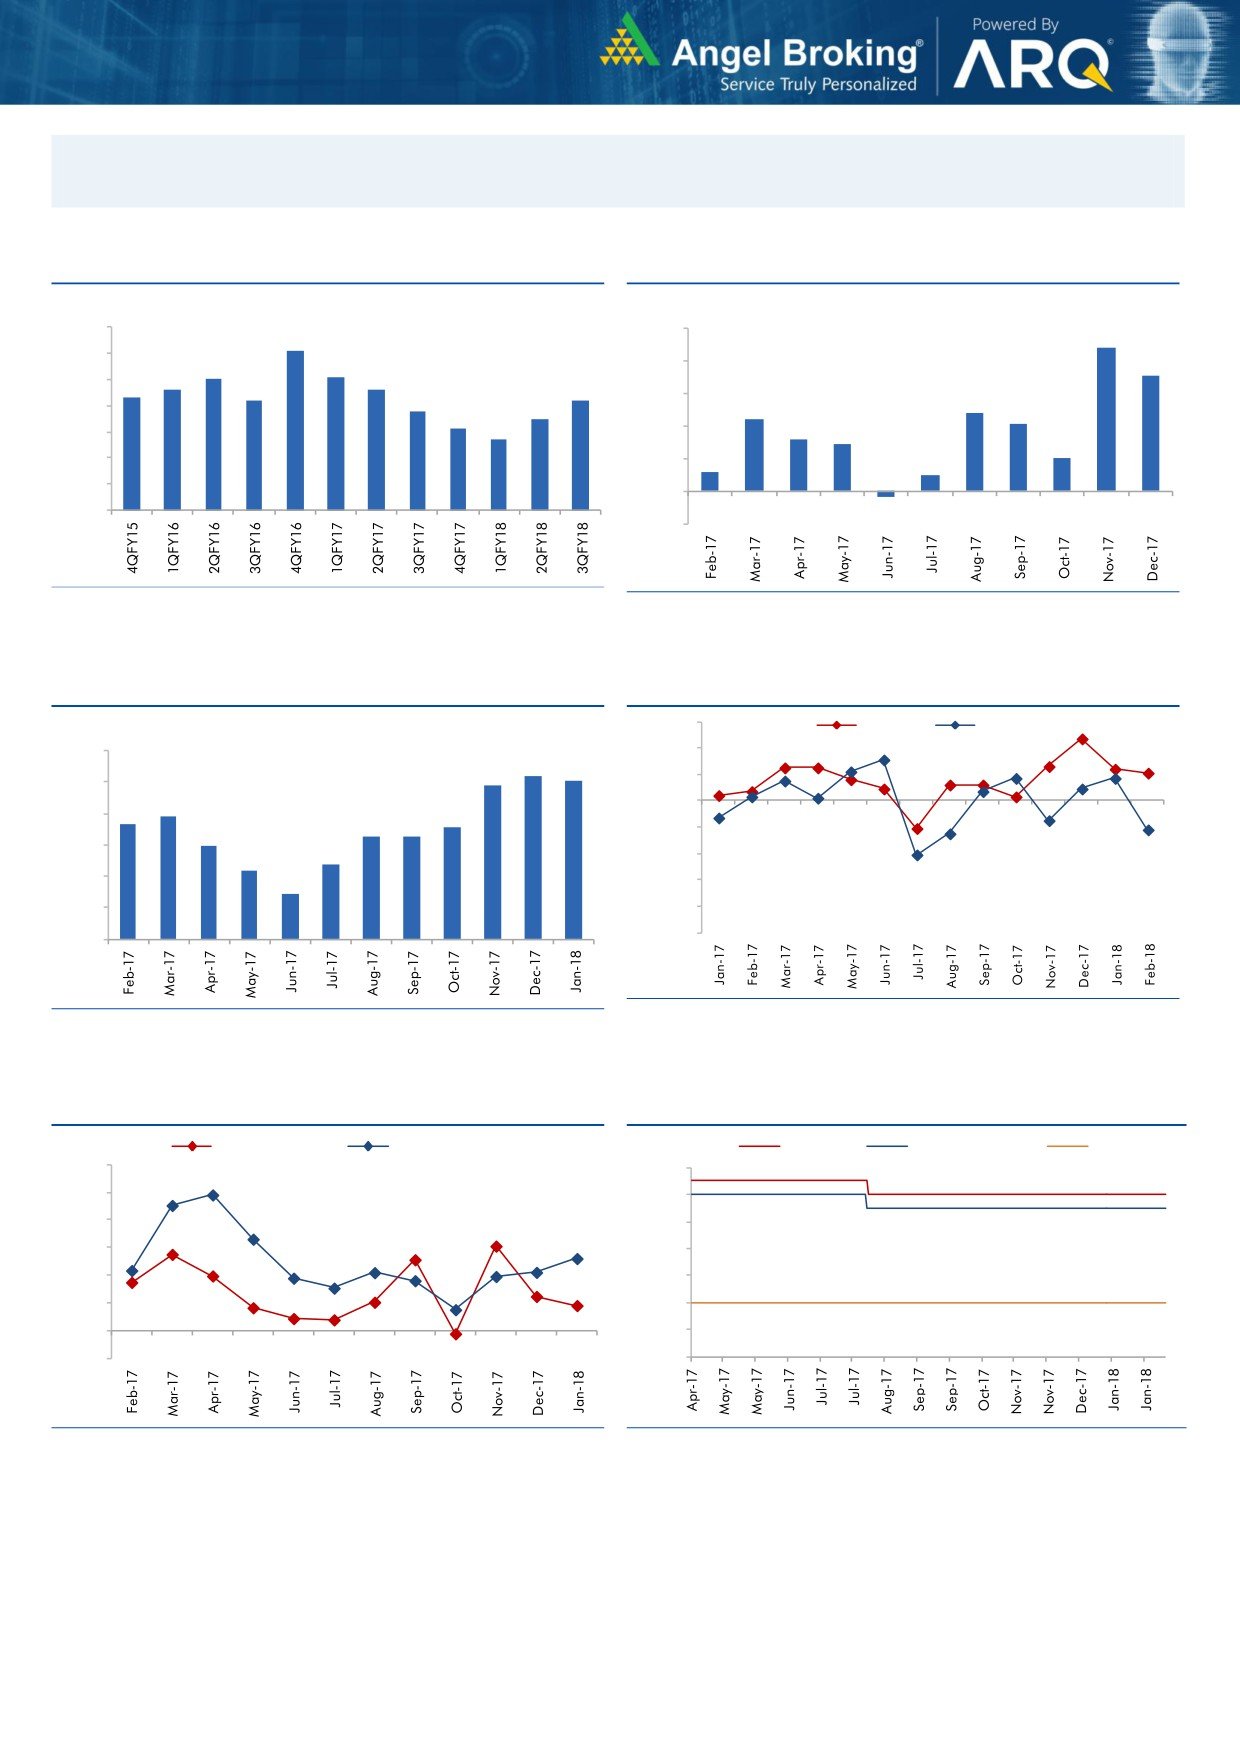
Macro watch
Exhibit 1: Quarterly GDP trends
Exhibit 2: IIP trends
(%)
(%)
10.0
10.0
9.1
8.8
9.0
8.0
8.1
8.0
7.1
7.6
7.6
8.0
7.3
7.2
7.2
6.8
6.0
4.8
7.0
6.5
4.4
6.1
4.1
5.7
4.0
3.2
2.9
6.0
2.0
5.0
2.0
1.2
1.0
4.0
-
3.0
(0.3)
(2.0)
Source: CSO, Angel Research
Source: MOSPI, Angel Research
Exhibit 3: Monthly CPI inflation trends
Exhibit 4: Manufacturing and services PMI
56.0
Mfg. PMI
Services PMI
(%)
6.0
54.0
5.2
5.1
4.9
52.0
5.0
3.9
50.0
3.7
3.6
4.0
3.3
3.3
3.0
48.0
3.0
2.4
2.2
46.0
2.0
1.5
44.0
1.0
42.0
40.0
-
Source: Market, Angel Research; Note: Level above 50 indicates expansion
Source: MOSPI, Angel Research
Exhibit 5: Exports and imports growth trends
Exhibit 6: Key policy rates
(%)
Exports yoy growth
Imports yoy growth
(%)
Repo rate
Reverse Repo rate
CRR
60.0
6.50
50.0
6.00
40.0
5.50
30.0
5.00
20.0
4.50
10.0
4.00
0.0
3.50
(10.0)
3.00
Source: Bloomberg, Angel Research
Source: RBI, Angel Research
Market Outlook
March 13, 2018
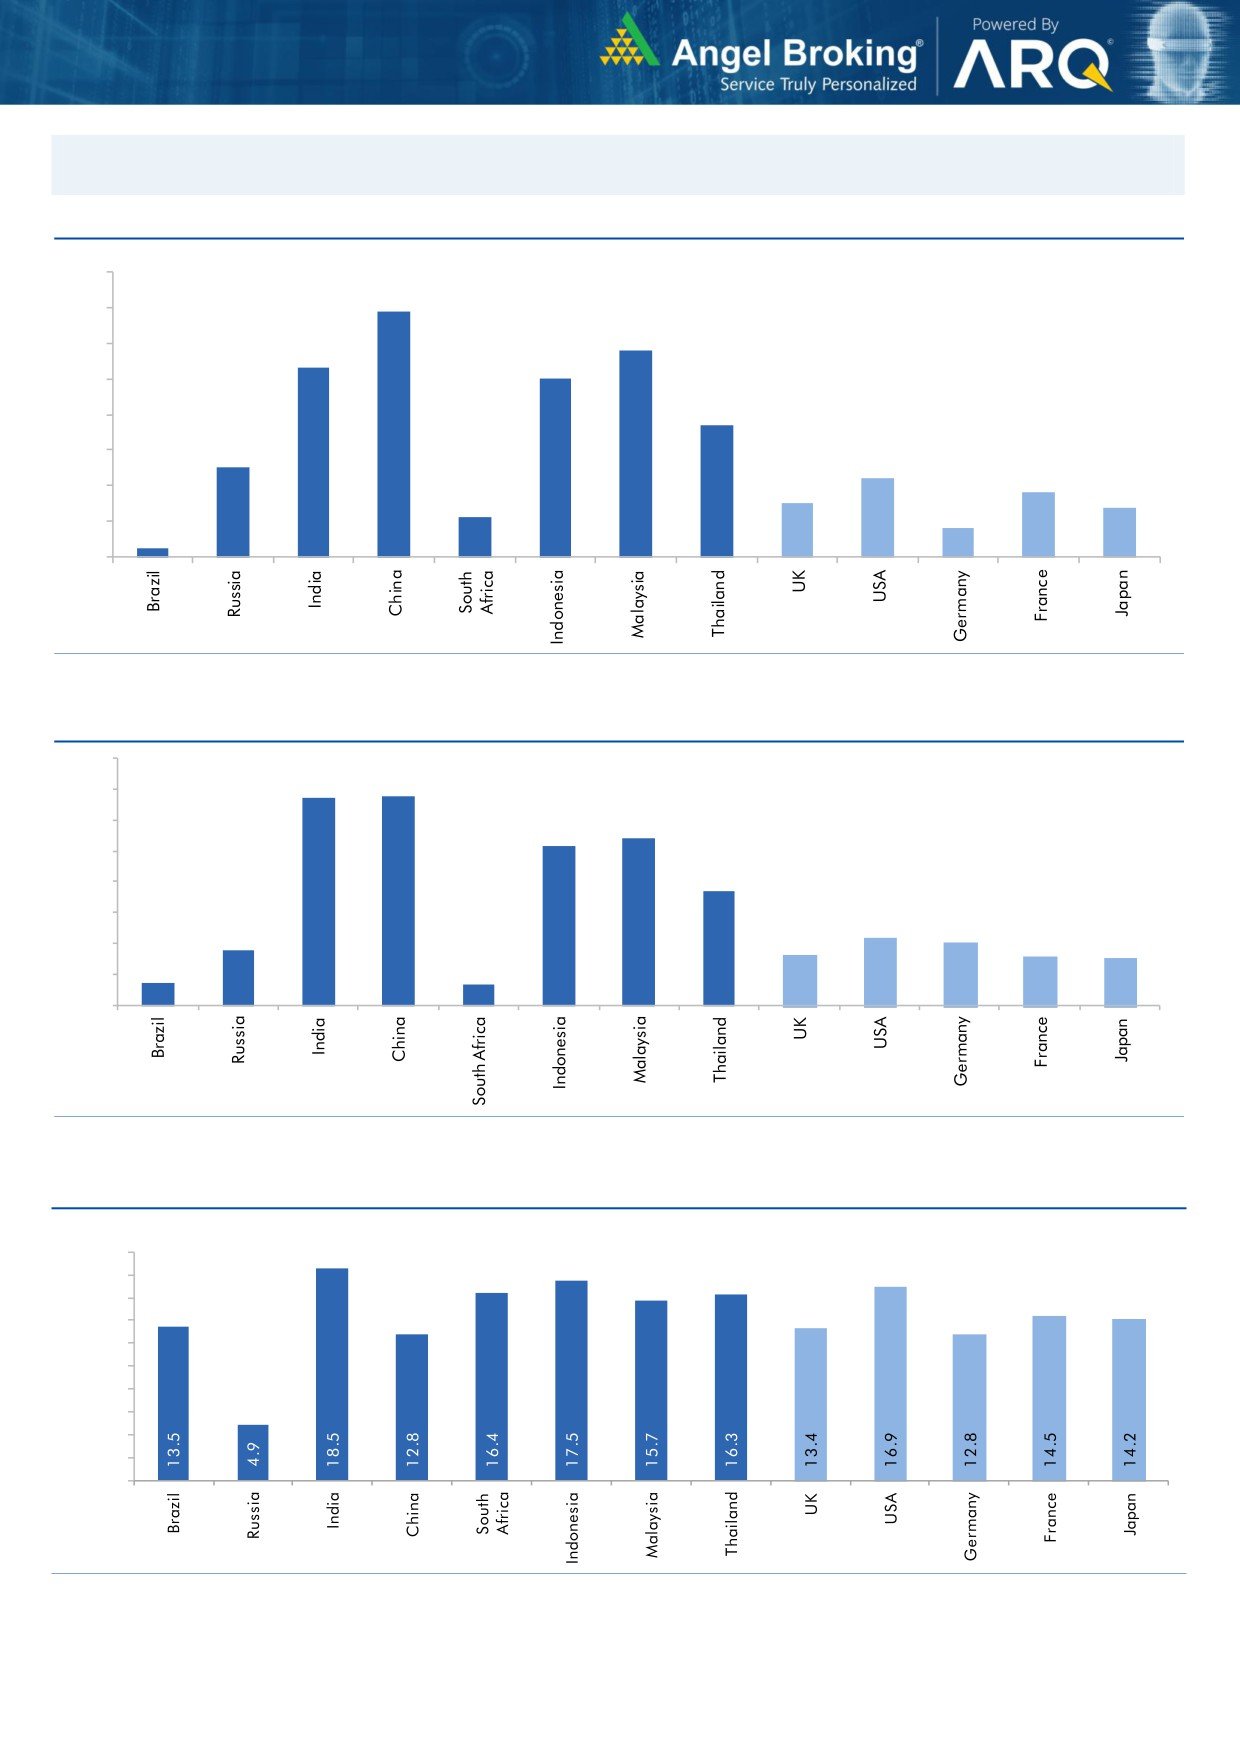
Global watch
Exhibit 1: Latest quarterly GDP Growth (%, yoy) across select developing and developed countries
(%)
8.0
6.9
7.0
5.8
6.0
5.3
5.0
5.0
1.1
3.7
4.0
2.5
3.0
2.2
1.8
2.0
1.5
1.4
0.8
1.0
0.3
-
Source: Bloomberg, Angel Research
Exhibit 2: 2017 GDP Growth projection by IMF (%, yoy) across select developing and developed countries
(%)
6.7
6.8
7.0
6.0
5.4
5.2
5.0
3.7
4.0
3.0
1.8
2.2
2.0
1.7
1.6
2.0
0.7
1.5
0.7
1.0
-
Source: IMF, Angel Research
Exhibit 3: One year forward P-E ratio across select developing and developed countries
(x)
20.0
18.0
16.0
14.0
12.0
10.0
8.0
6.0
4.0
2.0
-
Source: IMF, Angel Research
Market Outlook
March 13, 2018
Exhibit 4: Relative performance of indices across globe
Returns (%)
Country
Name of index
Closing price
1M
3M
1YR
Brazil
Bovespa
86,900
3.6
18.9
30.1
Russia
Micex
2,318
3.6
9.7
17.4
India
Nifty
10,421
(0.7)
3.8
16.5
China
Shanghai Composite
3,327
(4.0)
0.6
3.3
South Africa
Top 40
52,441
5.0
1.5
19.3
Mexico
Mexbol
48,671
1.7
3.6
3.3
Indonesia
LQ45
1,075
(3.3)
5.3
19.4
Malaysia
KLCI
1,861
1.3
7.9
8.5
Thailand
SET 50
1,191
2.7
9.2
20.8
USA
Dow Jones
25,179
1.1
4.3
20.6
UK
FTSE
7,215
0.6
(1.4)
(1.9)
Japan
Nikkei
21,824
0.8
(3.5)
12.1
Germany
DAX
12,418
1.3
(4.8)
3.6
France
CAC
5,277
2.4
(2.0)
5.3
Source: Bloomberg, Angel Research p68in4
Market Outlook
March 13, 2018
Research Team Tel: 022 - 39357800
DISCLAIMER
Angel Broking Private Limited (hereinafter referred to as “Angel”) is a registered Member of National Stock Exchange of India
Limited,Bombay Stock Exchange Limited and Metropolitan Stock Exchange Limited. It is also registered as a Depository Participant with
CDSL and Portfolio Manager with SEBI. It also has registration with AMFI as a Mutual Fund Distributor. Angel Broking Private Limited is a
registered entity with SEBI for Research Analyst in terms of SEBI (Research Analyst) Regulations, 2014 vide registration number
INH000000164. Angel or its associates has not been debarred/ suspended by SEBI or any other regulatory authority for accessing
/dealing in securities Market. Angel or its associates/analyst has not received any compensation / managed or
co-managed public offering of securities of the company covered by Analyst during the past twelve months.
This document is solely for the personal information of the recipient, and must not be singularly used as the basis of any investment
decision. Nothing in this document should be construed as investment or financial advice. Each recipient of this document should make
such investigations as they deem necessary to arrive at an independent evaluation of an investment in the securities of the companies
referred to in this document (including the merits and risks involved), and should consult their own advisors to determine the merits and
risks of such an investment.
Reports based on technical and derivative analysis center on studying charts of a stock's price movement, outstanding positions and
trading volume, as opposed to focusing on a company's fundamentals and, as such, may not match with a report on a company's
fundamentals. Investors are advised to refer the Fundamental and Technical Research Reports available on our website to evaluate the
contrary view, if any.
The information in this document has been printed on the basis of publicly available information, internal data and other reliable
sources believed to be true, but we do not represent that it is accurate or complete and it should not be relied on as such, as this
document is for general guidance only. Angel Broking Pvt. Limited or any of its affiliates/ group companies shall not be in any way
responsible for any loss or damage that may arise to any person from any inadvertent error in the information contained in this report.
Angel Broking Pvt. Limited has not independently verified all the information contained within this document. Accordingly, we cannot
testify, nor make any representation or warranty, express or implied, to the accuracy, contents or data contained within this document.
While Angel Broking Pvt. Limited endeavors to update on a reasonable basis the information discussed in this material, there may be
regulatory, compliance, or other reasons that prevent us from doing so.
This document is being supplied to you solely for your information, and its contents, information or data may not be reproduced,
redistributed or passed on, directly or indirectly.
Neither Angel Broking Pvt. Limited, nor its directors, employees or affiliates shall be liable for any loss or damage that may arise from
or in connection with the use of this information.